“How do I compare to others like me?” It is a very natural tendency to want to know how we measure up to others in our group. It’s one of the first questions a participant in a 360-degree feedback survey asks after receiving their report. So, when considering a 360-degree feedback instrument, let’s consider the pros and cons of including a comparative norm score in the feedback report.
Pros
Having a way to compare one’s own score against a norm group allows the participant to have a better sense of how they fit into the larger group. Do they generally score higher than the norm? Lower? What dimensions in the survey are lower than the norm? This awareness can help the individual focus on specific areas of development and improvement. On the other hand, when a participant sees where they score higher than the norm group, they can have a better understanding of their strengths, allowing them to put those strengths to strategic use in their work.
Cons
There are two possible disadvantages to having norm scores included in a feedback report:
- If an individual’s lowest scoring dimensions are still higher than the norm, they might not be as motivated to improve in that area. They might feel like they don’t need to work on a particular skill since they already score higher than most people on that skill.
- The makeup of the norm group might make it difficult to compare scores. For example, raters in one geographic region or one culture might be more conservative with the scale than others. If the participant does not feel represented in the norm group, then the norm scores will have less meaning for that participant.
Explaining the Makeup of the Norm Group
When using norm scores in a feedback report, it is important that the report also explain the makeup of the norm group. How many participants are in the group? Is the group made up of everyone who has taken the survey? Or is the group related to a specific demographic, like only those from a specific region, country, or company division? Understanding the makeup of the norm group will help participants know how to compare their own scores to the rest of the group.
Types of Norm Scores
Mean
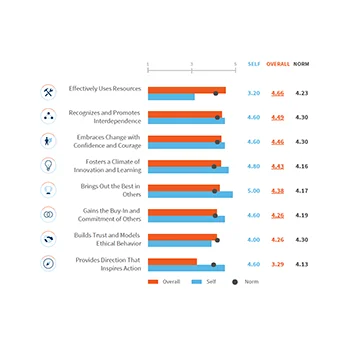
The most intuitive and thus most common way to report norm scores is to offer a mean score that compares directly to the participant’s own mean score for each survey item or dimension. This norm score is often included on charts or graphs to make it easy to visually compare and see whether the participant’s score is higher or lower than the norm score and by how much.
Percentile
Another useful way to compare scores against the norm group is through percentiles or percentile ranks, which answers the question, “My score was higher than what percent of the norm group?” For example, a score that is in the 90th percentile was higher than 90% of the scores in the norm group.
Top n Percent
A third option is to indicate when a participant’s score is in the “top 20%” or above the 80th percentile. This type of norm helps individuals identify where they are exceptional—allowing them to easily identify key strengths which they can strategically employ in their work.
Recommendations
We find that including a norm score is an important part of a 360-degree feedback report. The simplest and most intuitive kind of norm score is a simple mean based on all other participants who have completed the survey. If additional sophistication is desired for the feedback report, then percentile ranks or “top 20%” indicators should be considered.
Read more: 5 Principles of Report Design